It’s not fair that more than one in four children in the UK live in poverty.
More and more children are going hungry, without a bed to get a restful night sleep, or a warm home. Families who were once forced to choose between feeding their children or heating their homes can no longer afford either.

Everything is very expensive due to the high cost of living, but Barnardo’s has provided me with supermarket vouchers, so I’ve been able to do a food shop on occasions when this has been difficult
Paul
Young person living in a Barnardo’s Gap Home
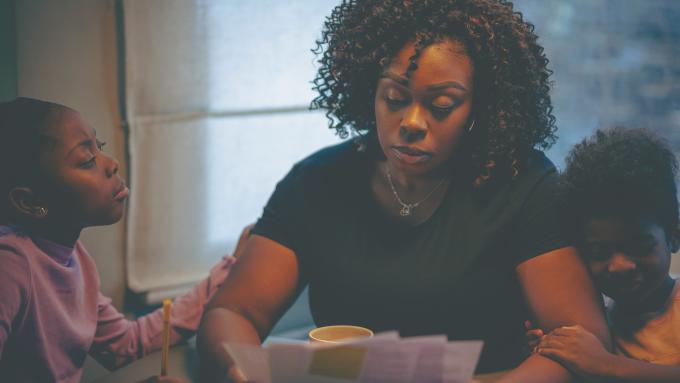
Together, we're helping families in financial hardship
This winter, our frontline staff helped struggling children and families by providing them with emergency support such as beds, access to food, and support with their mental wellbeing.
We also provide ongoing support all year round by helping to find suitable accommodation, and empowering families with access to longer term financial advice to set them up for a better future.
Through our influencing work, we’re standing up for every child with no bed of their own by calling on governments across the UK to ensure no child grows up in poverty.
In the last year our crisis support has helped more than 13,000 children and 7,200 families.

Find out more
Why families in poverty need the Household Support Fund
Read Ali Cooper, Senior Policy Advisor on Child Poverty at Barnardo's, explainer on what the Household Support Fund is, and why it needs to be extended to help children growing up in poverty. The Fund, which was due to end on March 31, will be extended for a further six months. However, this short-term extension still leaves many facing a cliff-edge in September.

"Life can be challenging [...], but Barnardo’s can make a real difference"
We've been providing support to children, young people and families in our services who are struggling to afford food, pay the bills, and maintain their wellbeing.

Get support
Struggling with the cost-of-living crisis? Don't be afraid to ask for help. Find out where you can get advice and support.
Work in partnership with us
We are calling on businesses across the UK to partner with us in addressing child poverty. Arun Estate Agencies Ltd. and their colleagues at Cubitt & West, Douglas Allen, Pittis and Wards have raised £1 million to help us provide essential support to children in South East England this winter.
Thank you for believing in children

Excluding retail costs, for every pound we spend approximately 94p goes on working with the children and young people who need it most. For more information see our annual report.